Mike Pascoe PhD: Optimizing SfN Poster Design Using Eye Tracking Software
Published by Chris Doering,
This week I attended my second SfN meeting in Washington D.C. In my spare time between poster sessions, I walked the entire vendor exhibition section browsing for companies that I know of. One vendor that caught my eye (pun to be appreciated shortly) was SensoMotoric Instruments, a developer of eye-tracking software.
A very helpful company representative took time to discuss the details of how the software works despite no obvious benefit of implementing their software in my research.
Then it hit me. If this eye tracking software can be used by web-designers to optimize the layout of their web pages, surely it can be used by researchers to optimize the layout of their conference posters.
The following day I returned to their exhibition booth with a PDF of my poster loaded on a USB drive. The gentlemen helped me load my poster into their eye tracking software called BeGaze and a new "experiment was launched". I was the subject and I was seated in front of a 17 in monitor that had an infrared eye camera that could automatically detect eye gaze direction and head position.
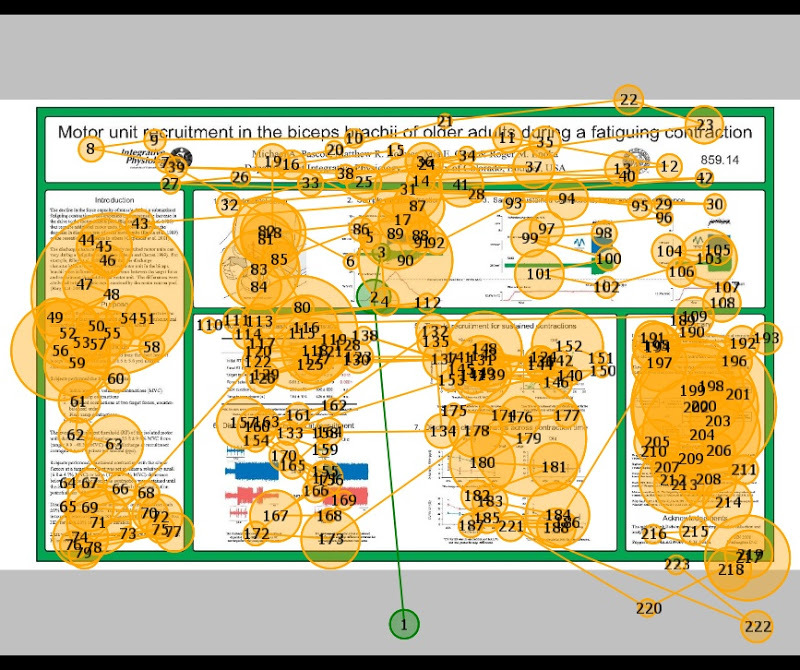
The video below shows the path my eyes took when scanning my poster:
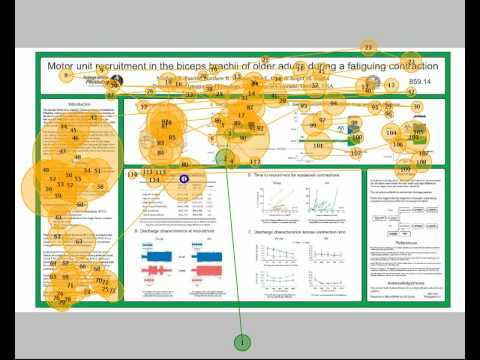
The larger the circle diameter, the longer time was spent focusing on that point.
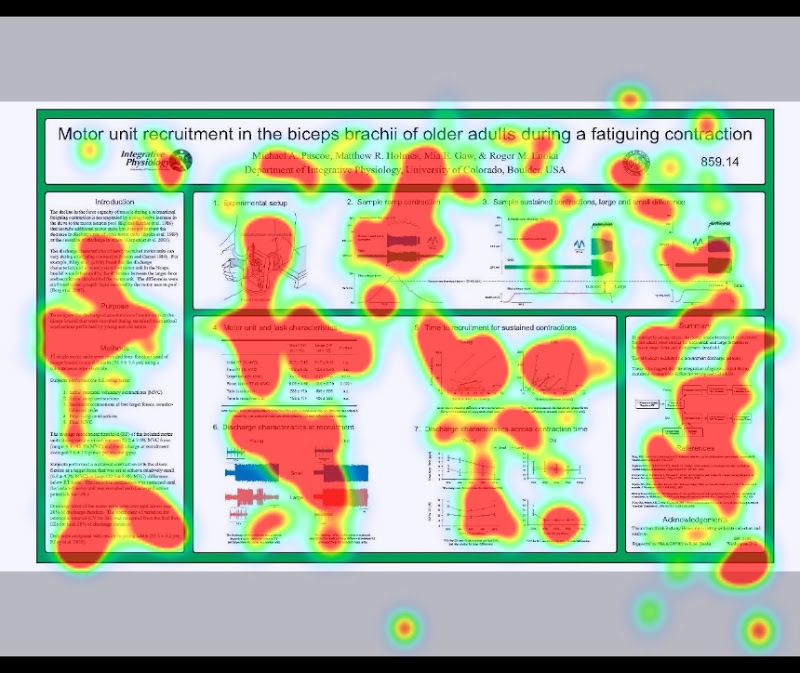
Once this data was collected, various options exist to describe the way I viewed my own poster. One of which is the colorful Attention Map. The idea here is that the areas of my poster that had a longer gaze time have "warmer" colors:
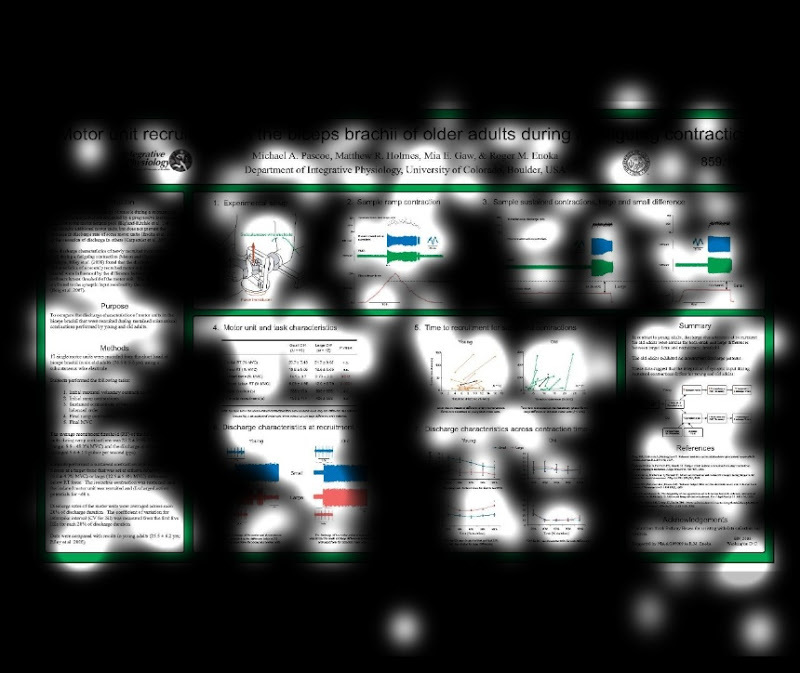
Another view is the Focus Map, which shows all areas that I looked at ignoring the time spent. This way I can see what areas I didn't even pay attention to:
To go to another level of analysis, you can assign regions of interest (e.g., title, intro, results, discussion, etc.):
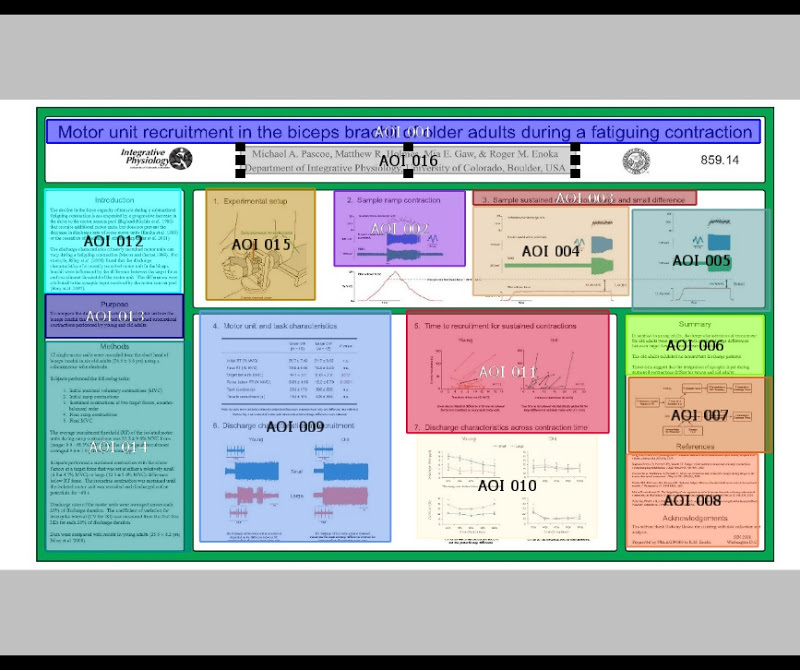
Then you can compare values of dwell time for a group of subjects and perform statistical analysis. I have made a graph here:
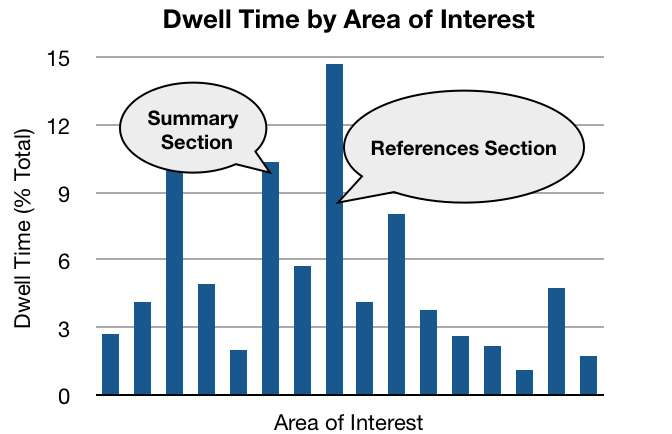
The data above are from one person, myself, but with more people viewing you may be able to get a real feel for what areas of your poster people focus on. You can also assess the path people take as they move through your poster and compare that to what you envisioned when you were putting it together in the lab.
I'm afraid I don't have the time to look into the application of this software to really fine-tuning your posters for next neuroscience. However, the representative at the booth was very excited at the prospect of setting up a kiosk at the SfN conference, having people load their poster file onto a computer, and then have the next 20 people that come scan their poster and collect data.
So if you see this next year at neuroscience you now know it came to be.
http://mikepascoe.blogspot.de/2008/11/optimizing-sfn-poster-design-using-eye.html